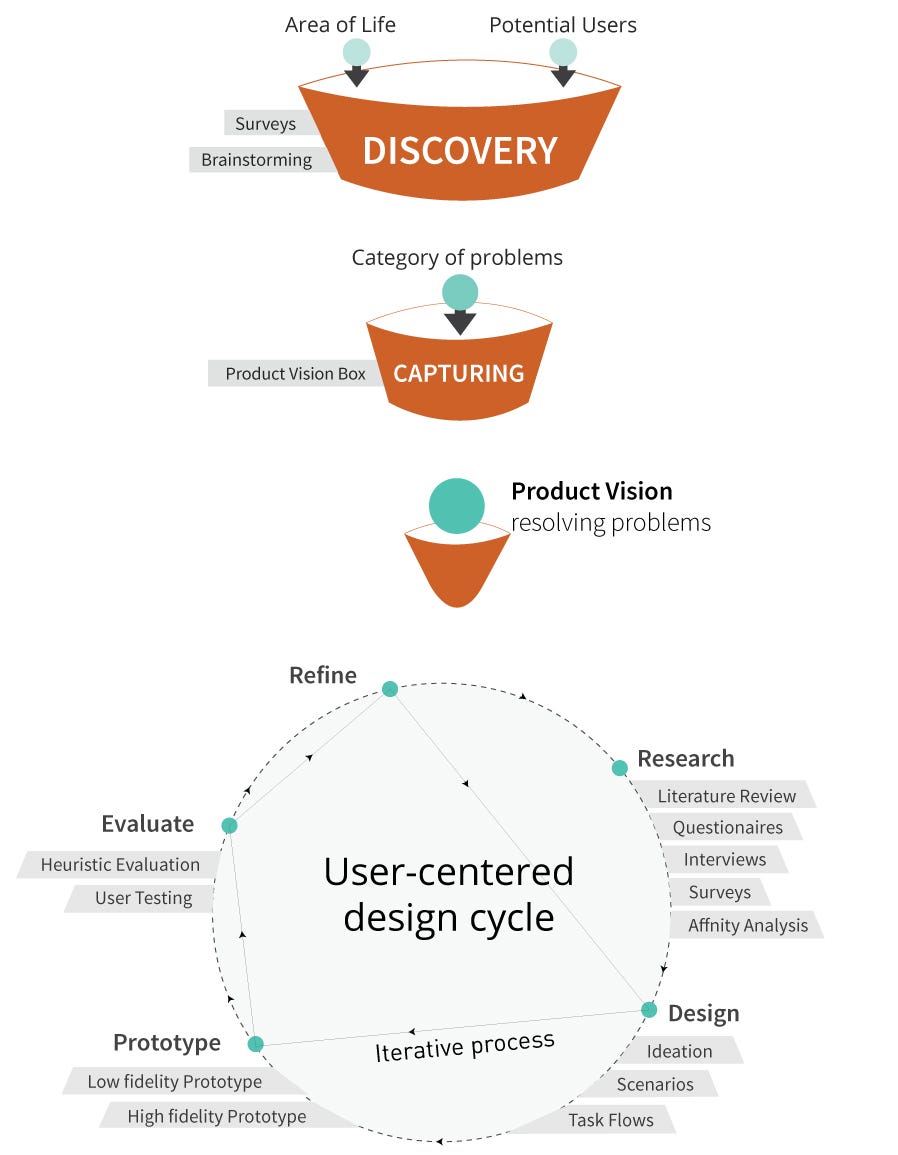
This article presents a methodology based on design thinking and user experience design methods for creating “People-Aware” IoT applications, where user needs, not technological opportunities drive the development. The methodology is divided into 7 steps: Discovery, Capturing, Research, Design, Prototype, Evaluate and Refine. The results of the methodology include well-described and user-oriented scenarios meeting user’s needs and also a complete toolbox to assist the implementation and the testing of above mentioned scenarios in an IoT perspective.
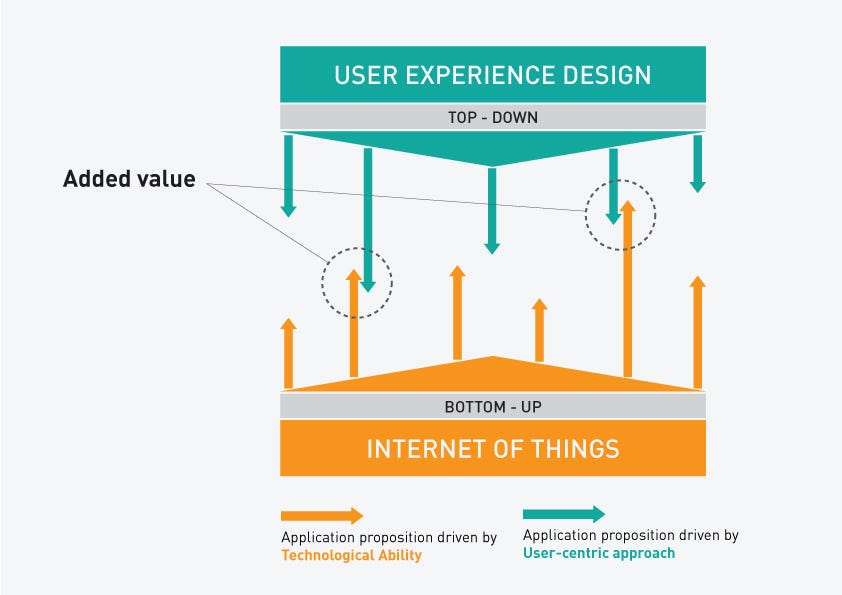
The Internet of Things consists of a growing network of everyday objects, from industrial machines to consumer goods, which are inter-connected, can share information and complete tasks while the user is busy with other activities, like work, sleep or exercise. The new services and applications introduced into the IoT market were until now dependent on technological interventions rather than demand. IoT is currently at a turning point where the hardware and technology are mature and the focus can be put on creating good user experiences.
Discovery
The « Discovery » step is the one in which we become acquainted with the users and the context of the future product we want to develop. This step consists mainly in setting up some loose boundaries inside which we want to identify what problems people encounter. The two main inputs of this step are the following:
1. Area of life
The context in which your potential users evolve (e.g. professional context: an office, a yard; domestic context: a building hall, a private house, etc.
2. Potential users
The people you find in the preset context. Starting with defining a context and potential users helps to keep in mind that the final IoT application will be part of a whole environment and will not be an isolated device operating on its own. Once the inputs are defined, several techniques are applied to gather information from the users.
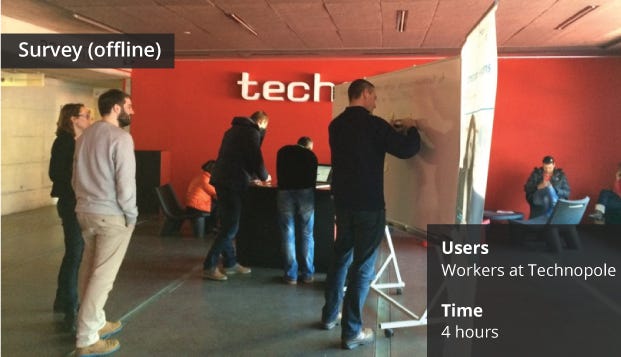
Survey
In this project, we defined a professional context, an office building, as the area of life with all the people working in the building as potential users. We then set up a survey containing one single question:
“Help us to improve your environment and quality of life in the building.”
The survey was held online and on a white board in the main entrance for a period of 4 hours. The question asked was open on purpose to gather as many different types of answers as possible and made no mention of IoT to avoid the users surveyed to be biased by any idea of existing smart systems. It is important to formulate the question in a proper way while keeping in mind the goal of the final product to get the appropriate answers. Together, both the online and physical surveys led to the identification of about 60 problems that we wrote down on sticky notes on a white board after removing duplicates
Brainstorming
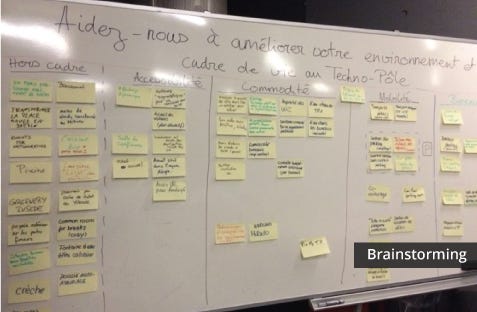
A dozen people among the users surveyed were chosen to participate in a brainstorming session. During this session, the answers on the sticky notes were refined and sorted. Out of-scope answers were removed and the remaining ones were sorted into four categories: accessibility (e.g. issues about visitors finding their way inside the building), facilities (light, temperature, or ventilation issues), mobility (public transport or parking issues) and office-related (clock in/out issues, flexible work spaces, better booking of meeting rooms). The defined categories of problems become a suitable input for the next step of the methodology.
Capturing
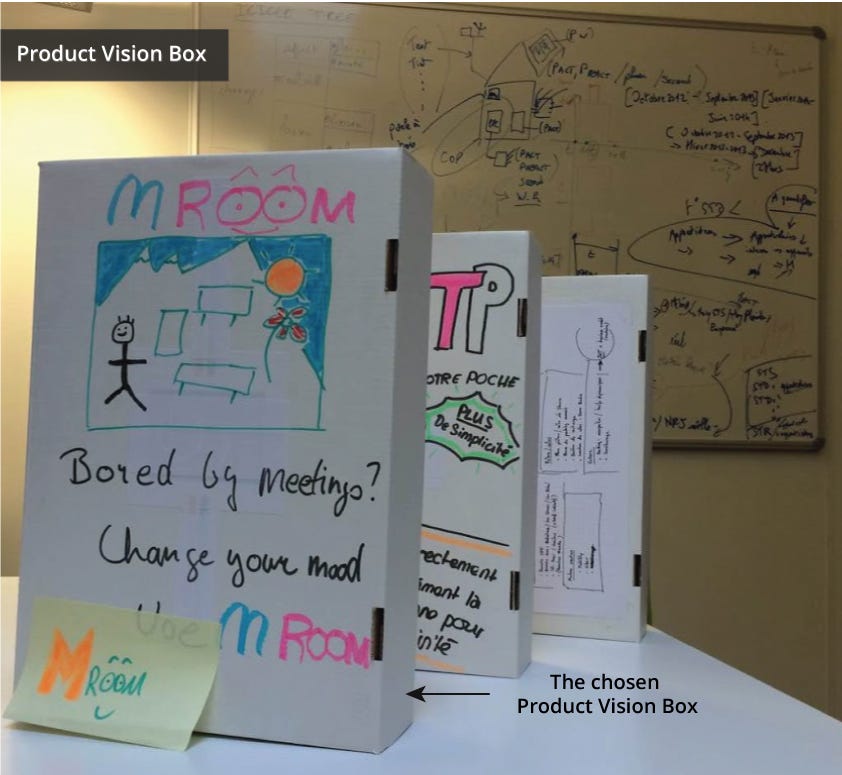
During the « Capturing » phase, we translate the initial problems identified into a product idea or vision. As this step is still in the idea-generation part of the process, the goal here is not to clearly define the end product but to specify a vision or an idea of this end product that will be refined in the next steps of the methodology. For our use-case we adapt the technique called the “product vision box” borrowed from the agile project methodology. The technique consists in creating an actual physical box to picture your product where each side of the box summarizes the features of the product. In the initial exercise a team of potential users is divided in sub-groups that are each asked to create a product box. At the end of the workshop a single box is created in agreement of all the teams together. In our workshop we picked the participants among potential users and practitioners in the project. Since the goal was to produce several IoT applications, each team was asked to pick one category among those identified in the Discovery phase and to develop a product vision box that fits in this category. Another instruction was to make a product including IoT but the participants were asked to think about IoT as a “magical toolbox”. At this stage we decided to include the IoT notion but more to open perspectives and not as a limiting condition. The categories picked were: facilities, mobility and office-related. The exercise led to the creation of three product vision boxes. 1. “Fix My TP1 ”: a concierge in your pocket. A system that allows the residents of the building to report any facility issue directly to the right person. 2. “The M-Room”: The mood-room — an idea of a smart meeting room adapting to the mood of their participants. 3. “Mobility Portal”: A web portal that provides information about mobility-related issues for the office building (parking, bicycle, bus, etc.) This exercise asks the participants to be explicit enough about the benefits and features offered by the application for them to be described on a single box. Therefore, the output of this capturing phase is a product box depicting an application vision or idea. In our use-case, we chose the “M-Room” box, depicting a smart meeting room as it was the easiest for us to implement in the premises available for the project.
Research
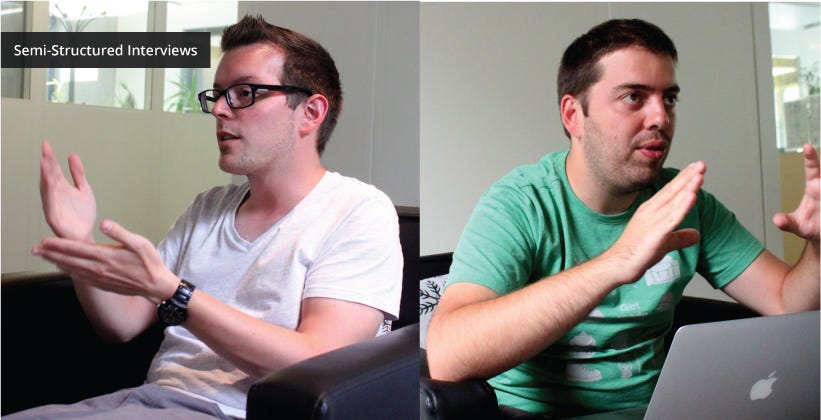
The work to be done on the “Research” phase is based on the output of the last phase: the product vision box. Following the methodology, we are now entering a new iterative cycle in which the product idea will be refined. At this stage in our research, we chose qualitative methods. We performed various semi-structured interviews within stakeholders working inside the office building to identify their needs, goals and experiences during meetings. Based on the interviews, the following insights were generated: 1. The concentration level of the user generally follows a Poisson distribution i.e. initially it increases and then decreases exponentially due to a lot of factors: – People have to multi-task while they are in meetings (write notes, search on the web, or hear the speaker) – The environment, such as the light and temperature of the room, can have an impact on the concentration level. 2. Users do not have much contextual information regarding the subject being talked about which affects their concentration/engagement level in the meetings. Sometimes the speaker uses very company-specific acronyms and terms that a novice user or a person who did not attend the previous meeting has no idea about. 3. Users sometimes have the feeling that meetings are a waste of time because the goals are not clearly defined, the outcomes are not clear and they have difficulty tracking the progress of the meeting. 4. Some users feel frustrated about the decision-making process in a meeting, they find it difficult and too long (with too much discussion) to reach a consensus. 5. People are often reluctant to take notes in meetings. Based on the qualitative data from the interviews, we created 3 personas, user scenarios and an affinity diagram. A persona is a fictional character that represents the needs of a group of users. In parallel of the user research we also performed a context research. The context has to be considered as a part of the application as much as the users. We started by listing all the elements in a smart meeting room that can be affected or controlled by an IoT system. When thinking of a meeting room, it usually includes a table, chairs, a projector and lights. These are all elements on which actions can be performed. But you have also the door, the temperature, or the walls. Various brainstorming sessions helped us identify these elements and the types of actions can be performed with them (e.g. displaying something on the wall, adjusting the light, count the number of people sitting). Having a good picture of the context in which your application will be deployed will help in the designing phase. It also allows identifying what input data are available and what kind of output you can provide to the users and by which support.
Design
This phase ensures that the design of the system meets all the user’s requirements and needs obtained from the research phase. It is generally done by a designer relying on the outcomes of the previous phases. On the basis of the problems identified by the affinity analysis, we ideated various scenarios, which described the broader context in which different personas behave and interact within the existing system. We turned towards exploring Tangible User Interfaces in the context of a meeting scenario. Tangible user interfaces come under the umbrella of Reality-based interactions, a concept proposed by Jacob, which basically leverages user’s existing knowledge and skills of interaction with the real non-digital world. Such interfaces have the potential to ease the manipulation of different information and decision-making in a more collaborative manner rather than using graphical user interfaces. We aimed to use tangible user interfaces so that the users can manipulate the large set of information in the meetings in a more natural and collaborative manner. For our use case, we conceptualized the idea of a cubical tangible block which can be used to manipulate the information and activities in the meetings. The three opposing sides of the cube consist of elements such as SmartInfo, Agenda and Decision. The affordance of the cubical token such as sliding or rotating can be mapped to relevant activities and actions. We used scenario illustrations to understand the overall context of use of our system.The description of the user journey in various scenarios is written below:
Roger, one of the users, has just recently joined Technopôle, and did not attend the initial meetings on an ongoing project. Roger is sitting inside the meeting room and the presenter is giving a presentation which involves data from previous presentations. The presenter uses an expression, which Roger is unfamiliar with. He is reluctant to disturb anyone to ask or search on the web about it during the meeting. Using the tangible token, he can view that content easily while in the meeting without disturbing anyone. The system automatically maps the relevant information on the table to the side of the cubical tangible token corresponding to SmartInfo.
Another scenario is where the users feel frustrated as they see that the goals of the meeting are not defined. In such a case, the Agenda side of the tangible token is useful to see tag clouds related to the project or the progress of the meeting.
Prototype
Prototyping allows designers to test scenarios from the previous step against usability issues and helps visualize the idea of the product. There are two levels of prototyping: lowfidelity and high-fidelity, where the difference is set in the level of detail of each level. In user interface design, with the lowfidelity prototypes, the interaction with the user is often simulated. It usually doesn’t involve any actual technology, therefore it is quicker and cheaper to implement and are affordable to non-technical members of the team. On the other hand, high-fidelity prototypes have a high level of detail and allows partial to full interaction with the system functionalities. However it is expensive and time-consuming. At the time of writing this article, the prototyping phase of our use case is not fully completed. Yet, we decided to build the first version of our prototype with actual hardware devices since it will also allow us to test their reliability and also because we already had some devices and an environment available to build a prototype. In case you don’t have any materials, a simulated prototype is recommended at first. We think having an idea of the devices you want to use can also help in building adequate interaction. Finally, we would like to raise that simulating a whole experience of an IoT application including the environment and all its elements can be a huge task. Moreover, when resources allow, high-fidelity prototypes that include logging capabilities could be developed in this phase. They could be used in the next phase for gathering quantitative data about the usage of the prototype that would complement qualitative data obtained from post-test interviews with users.
Evaluate
Evaluate When designing for a classical screen-based interface, there are several heuristics (or usability principles) that are often used to evaluate the problems associated with the design of the interface such as Nielsen’s heuristics. Some of them can also be applied to an IoT-based system and we believe that several new heuristics specific to IoT will arise with the spread of the field. We aim to identify such evaluation indicators by the end of this research project. Another way to evaluate a prototype is the use of usability testing methods. There are various methods that can be used, such as the “thinking aloud”, where the tester is asked to talk aloud his thoughts while using the system. The process of a usability test is basically the same for every method. You first pick representative users to test your system, then you select a typical and well described scenario that the user will be performing in the test, and finally you report the results. Moreover, if high-fidelity prototypes were developed in the previous phase, quantitative usage data logged by the systems may be analyzed in this phase as a useful complement to the data obtained from qualitative testing methods. Since there are various guidelines and methods described in the literature about usability testing and we are only at the stage of prototyping in our use-case, we will not explain this step in further detail.
Refine
At the end of the evaluating phase, test results are reported. It is in this “Refine” phase that the results of these tests are handled and transformed into new adjustments for the next cycle of the product in the iterative loop of the methodology. It is important to clearly define the objectives and readjust them accordingly to the user tests and evaluation phase results. From an IoT perspective, it would be wise in this phase that you consider technical aspects and feasibility of your product idea. Finally, be clear on the refinements you want to implement for the next cycle. It is always better to run through the whole cycle until the “Evaluate” phase than making changes along the way due to unclear objectives or assumptions. Iterative cycles can also be shortened and occur more often, depending on the number of changes you decide to make. Here is the link to the original article. Thanks for reading 🙂 Keep following @designerrslab for more insightful articles related to User Experience Design. www.designerrs.com
Design Thinking and UX for Internet of Things (IoT) was originally published in DSchool on Medium, where people are continuing the conversation by highlighting and responding to this story.